Project Goals
The project proposes a platform for individual and collective awareness and decision making, where the interpretation of results can be used for real time navigation through the city, opportunistic selection of locations according to their air conditions and a base for political action.
EXHIBITION
In the Air has been displayed in different venues. Please check our blog for news.
Description
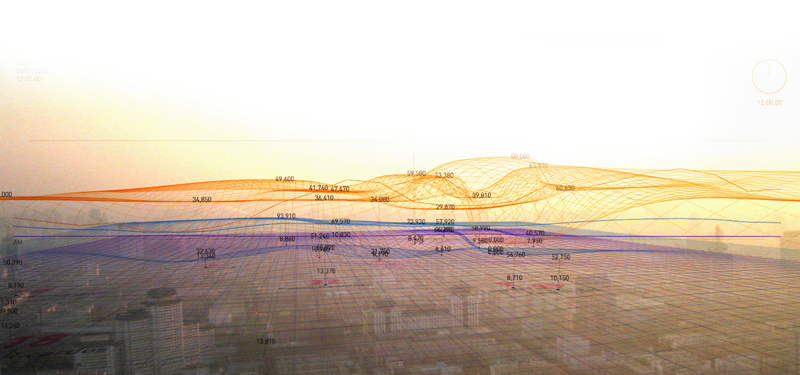
In the Air is a visualization project which aims to make visible the microscopic and invisible agents of Madrid´s air (gases, particles, pollen, diseases, etc), to see how they perform, react and interact with the rest of the city.
The visualization tool is a web-based dynamic model which builds up the space the components generate, where through data crossing behavior patterns emerge. The results of these data feed a physical prototype of what we have called a “diffuse façade”, a massive indicator of the air´s components through a changing cloud, blurring architecture with the atmosphere it has invaded and mediating the activity of the participants it envelops.
![]()
![]()