Information Code
The prototype shows the data the nearest sensor station. In the case of Medialab Prado it is Recoletos Station.
SO2= Red
CO= Green
NO2= Blue
Particulate PM10= Yellow
O3= Violet
Time of emmision= density of the component in the air
10sg= the density is below the admited limit
30sg= the density is above the admited limit
Rhythm of intervals indicates changes in pollutant data. If the intervals speed up, the density of a component is increasing and if they slow down it is decreasing. The data is updated hourly and therefore the rhythm of change will be slow.
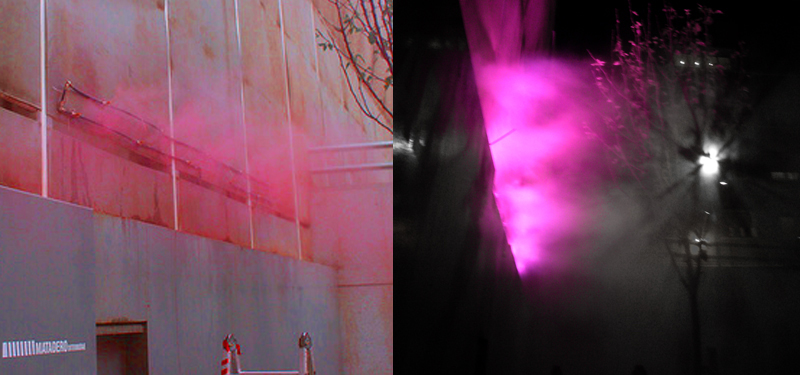
Physical Prototype
It is a prototype of what we have called a “diffuse façade” a massive indicator of the air´s components through a changing cloud.
Built in Medialab-Prado with water vapor diffusors, at the same time as informing the passerby of the level of each component in the air it changes the microclimate around reducing the temperature in the summer and humidifying the environment in the winter.
The water vapour also has a slight function, mildly cleaning the air as the water dye/colorant is organic and does not add contaminants to the atmosphere.
Video
Watch a video of the physical prototype in action.